Browse the reports
-
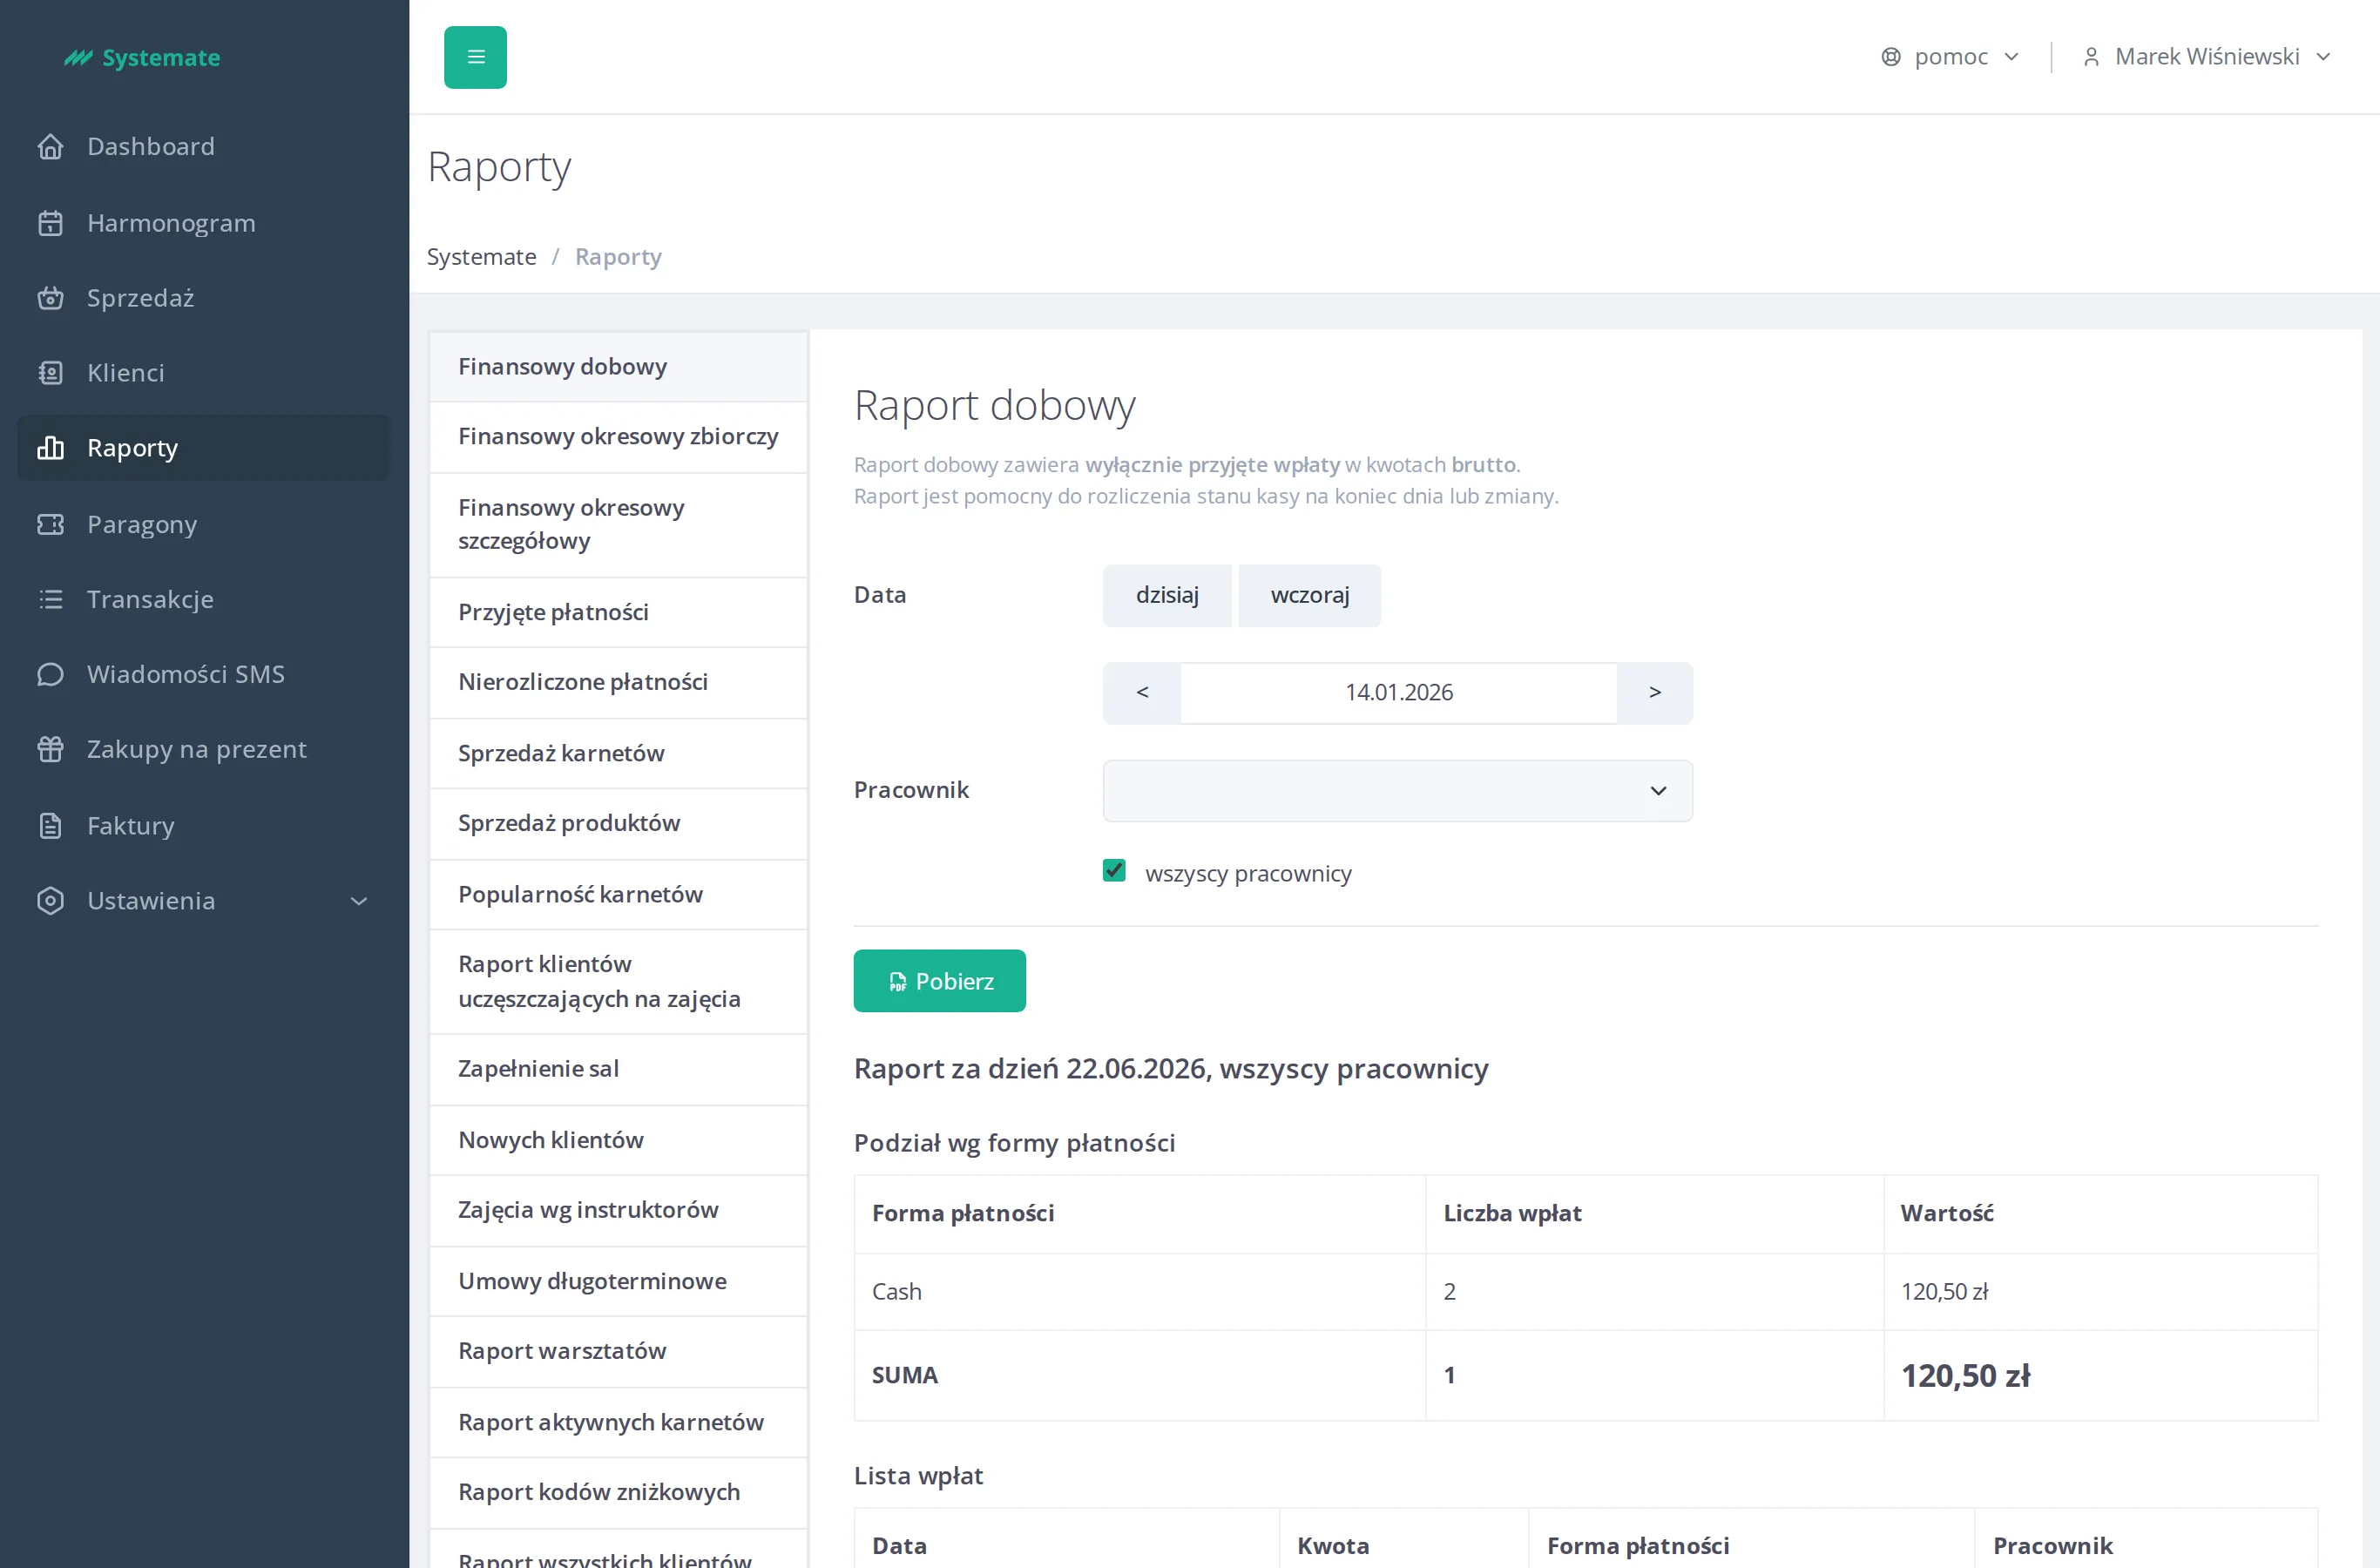
In the office panel open Reports.
-
Pick a report from the list on the left. The reports cover a few areas:
- Finances — Financial daily, Periodic financial report, Detailed periodic financial report, Received payments, Unsettled payments.
- Sales — Pass sale, Product sales, Passes popularity, Coupons redemptions.
- Customers — New clients, Report on clients attending classes, All clients report, Active passes report, Contracts.
- Classes — Class attendance, Class report by instructors, Classroom seat usage, Workshops report.
-
Set the parameters at the top of the report — most reports ask for a date or a date range, and some let you narrow the results to one Employee. The All clients report can optionally be limited to a single tag in the Tag field — the export then covers only customers holding that tag. The field appears only when your studio has the customer tags feature enabled; by default the report covers all customers.
-
The results appear below the parameters as summary and detail tables.
-
To take the data with you, use the button above the results: Download saves a PDF, Export exports the data. The Report on clients attending classes sends its export to your e-mail address within a few minutes.
Class attendance
Section titled “Class attendance”The Class attendance report answers how many people on average come to a given kind of class, and in which recurring slot (weekday and start time) attendance is weakest.
On entry the report already shows the current month for every class type and every instructor. To see anything else, set the parameters and press Generate — changing a parameter on its own recalculates nothing, so you can set them all before you run the report.
- Date range — type it in or use the shortcuts above the field.
- Class types — click the field to open a panel of checkboxes. At the top of the panel sit a search box (type part of a name to shorten the list) and a Select all checkbox that selects or clears the whole list in one click. While a search is active it turns into Select the matches and acts only on what is visible. The collapsed field says how many class types are selected, and their names are listed underneath (shortened for a longer selection, with an …and N more link). With no class type selected the report has nothing to count and says no data.
- Instructor — optionally narrow the report down to a single instructor.
- What we count — decide whether to count Registrations or only Confirmed attendance.
What the report counts:
- Only classes with the active status — cancelled and planned ones stay out of the results.
- A class nobody came to counts as zero rather than being skipped. The Sessions with no attendees column shows how many such classes there were.
How to read the columns:
- Median is the middle of the distribution — half of the classes had that many people or more. Unlike the average, it is not inflated by one exceptionally full class.
- 25th percentile is the level of the weakest classes — a quarter of the classes had that many people or fewer. A large gap between the 25th percentile and the median means attendance swings a lot.
- Occupancy is the average filling of a single class and is computed only from classes
that have a number of seats set. The
68% (28 of 34)form means that the 68% is an average over 28 classes out of 34 — the remaining 6 have no number of seats set. That is why this number differs from the Classroom seat usage report, which computes what share of all offered seats was taken. The remaining columns cover all classes.
Every class type row can be expanded: the first column of the table, under the Details header, carries an arrow — pointing right while the row is collapsed and down while it is expanded. Click the arrow, or anywhere in the row, to see that class type’s recurring slots together with a chart of the average attendance week by week (for short ranges) or month by month. The recurring slots are laid out the way the timetable is: Monday through Sunday, and within a day from the earliest start time. Pressing Generate again collapses every row.
Export saves both levels — the class type rows and the recurring slot rows — in the same order the table shows them.
To review individual transactions instead of aggregates, see Review transactions.